Linux Mint - Gnuplot でグラフ描画!
Updated:
Linux Mint で、2次元や3次元のグラフを描画するためのコマンドラインツール Gnuplot を使用してみました。
0. 前提条件
- Linux Mint 17.1(64bit) での作業を想定。
- Apt パッケージを使用して 4.6.4 をインストールする。
1. Gnuplot のインストール
$ sudo apt-get install gnuplot-x11
注意するのは gnuplot でなく gnuplot-x11 をインストールするということ。
(こうしないと、 Gnuplot を起動してコマンドを入力してもグラフウィンドウが開かない)
ちなみに、最新バージョンの Gnuplot をインストールしたければ、以下のようにしてインストールすればよい。(但し、環境によってはスムーズ(or 綺麗)にインストールできないかもしれない)
$ wget http://sourceforge.net/projects/gnuplot/files/gnuplot/5.0.1/gnuplot-5.0.1.tar.gz
$ tar zxvf gnuplot-5.0.1.tar.gz
$ cd gnuplot-5.0.1
$ ./configure
$ make
$ sudo make install
2. インストールの確認
$ gnuplot --version
gnuplot 4.6 patchlevel 4
もしくは、以下のように Gnuplot を起動してみる。
$ gnuplot

        G N U P L O T
        Version 4.6 patchlevel 4    last modified 2013-10-02
        Build System: Linux x86_64

        Copyright (C) 1986-1993, 1998, 2004, 2007-2013
        Thomas Williams, Colin Kelley and many others

        gnuplot home:     http://www.gnuplot.info
        faq, bugs, etc:   type "help FAQ"
        immediate help:   type "help"  (plot window: hit 'h')

Terminal type set to 'wxt'
gnuplot>
使用するターミナルが wxt or x11 であることを確認する。unknown だと、コマンドを入力してもグラフウィンドウが立ち上がらない。
unknown なら set terminal wxt or set terminal x11 で設定する。
3. 動作確認
3-1. 動作確認・その1
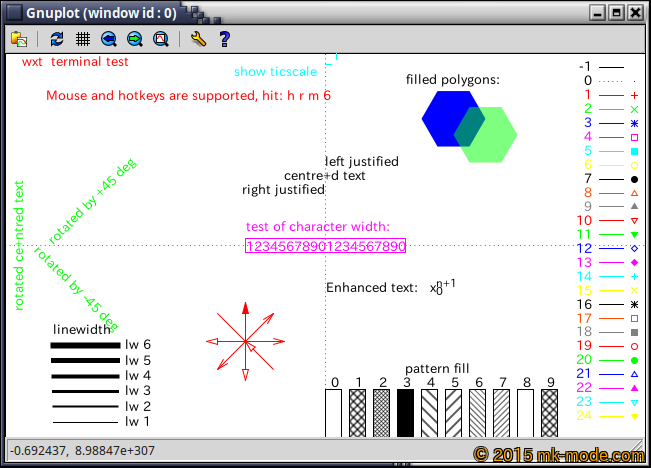
Gnuplot を起動後、テストコマンドを入力してグラフを描画してみる。
gnuplot> test
3-2. 動作確認・その2
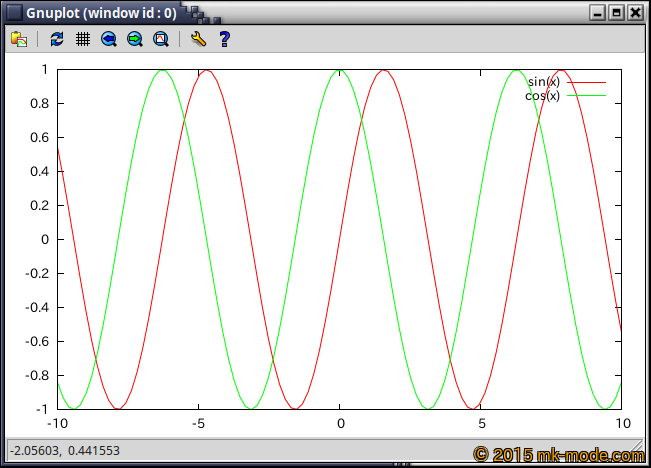
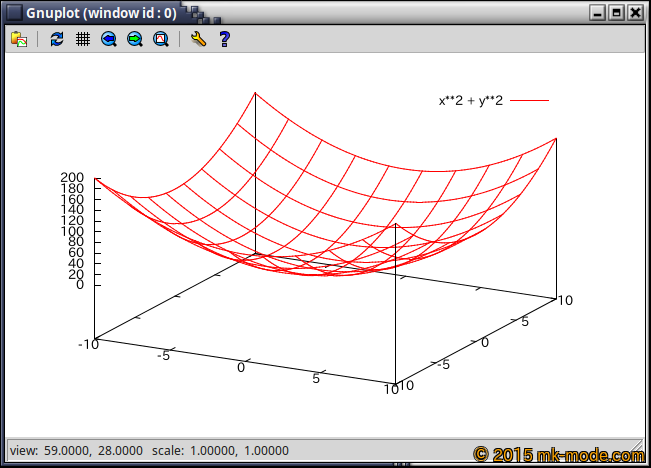
Gnuplot を起動後、コマンドを順次入力してグラフを描画してみる。
gnuplot> plot sin(x)
gnuplot> replot cos(x)
gnuplot> splot x**2 + y**2
3-3. 動作確認・その3
予め作成しておいたスクリプトを呼び出してグラフを描画してみる。
まず、例として以下のようなスクリプトを作成する。
File: gnuplot_sample.plt
1
2
3
4
5
6
7
8
9
10
11
12
set dummy u,v
set key bmargin center horizontal Right noreverse enhanced autotitles nobox
set parametric
set view 50, 30, 1, 1
set isosamples 50, 20
set hidden3d back offset 1 trianglepattern 3 undefined 1 altdiagonal bentover
set ticslevel 0
set title "Interlocking Tori"
set urange [ -3.14159 : 3.14159 ] noreverse nowriteback
set vrange [ -3.14159 : 3.14159 ] noreverse nowriteback
splot cos(u)+.5*cos(u)*cos(v),sin(u)+.5*sin(u)*cos(v),.5*sin(v) with lines, \
    1+cos(u)+.5*cos(u)*cos(v),.5*sin(v),sin(u)+.5*sin(u)*cos(v) with lines
そして、Gnuplot を起動後に呼び出してみる。
gnuplot> load "gnuplot_sample.plt"
もしくは、以下のように呼び出してみる。(call は load と異なり引数も渡せる)
gnuplot> call "gnuplot_sample.plt"
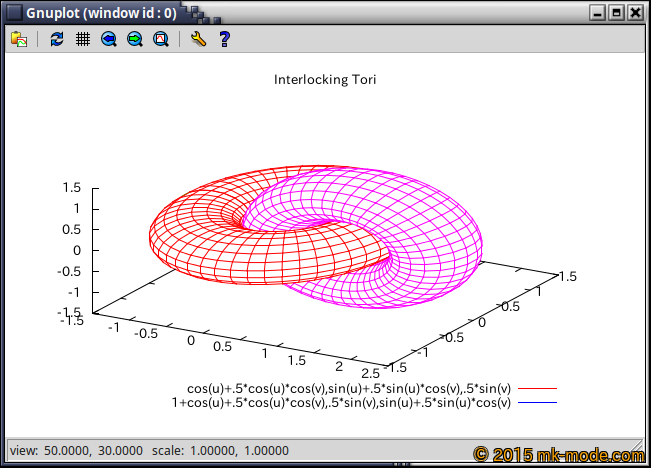
ちなみに、3次元グラフの場合はマウスで視点を移動できる。
3-4. 動作確認・その4
前項の Gnuplot スクリプトをそのままシェルスクリプト(Bash)に記述し、それを実行してグラフを描画してみる。
File: gnuplot_sample.sh
1
2
3
4
5
6
7
8
9
10
11
12
13
14
15
16
17
18
#!/bin/bash

gnuplot -p << EOS
set terminal pngcairo enhanced font "arial,10" fontscale 1.0 size 500, 350
set output 'gnuplot_sample.png'
set dummy u,v
set key bmargin center horizontal Right noreverse enhanced autotitles nobox
set parametric
set view 50, 30, 1, 1
set isosamples 50, 20
set hidden3d back offset 1 trianglepattern 3 undefined 1 altdiagonal bentover
set ticslevel 0
set title "Interlocking Tori"
set urange [ -3.14159 : 3.14159 ] noreverse nowriteback
set vrange [ -3.14159 : 3.14159 ] noreverse nowriteback
splot cos(u)+.5*cos(u)*cos(v),sin(u)+.5*sin(u)*cos(v),.5*sin(v) with lines, \
    1+cos(u)+.5*cos(u)*cos(v),.5*sin(v),sin(u)+.5*sin(u)*cos(v) with lines
EOS
この “gnuplot_sample.sh” は以下のようにしてもよい。
#!/usr/bin/gnuplot -p

set terminal pngcairo enhanced font "arial,10" fontscale 1.0 size 500, 350
set output 'gnuplot_sample.png'
set dummy u,v
set key bmargin center horizontal Right noreverse enhanced autotitles nobox
set parametric
set view 50, 30, 1, 1
set isosamples 50, 20
set hidden3d back offset 1 trianglepattern 3 undefined 1 altdiagonal bentover
set ticslevel 0
set title "Interlocking Tori"
set urange [ -3.14159 : 3.14159 ] noreverse nowriteback
set vrange [ -3.14159 : 3.14159 ] noreverse nowriteback
splot cos(u)+.5*cos(u)*cos(v),sin(u)+.5*sin(u)*cos(v),.5*sin(v) with lines, \
    1+cos(u)+.5*cos(u)*cos(v),.5*sin(v),sin(u)+.5*sin(u)*cos(v) with lines
実行権限を付与して、実行。
$ chmod +x gnuplot_sample.sh
$ ./gnuplot_sample.sh
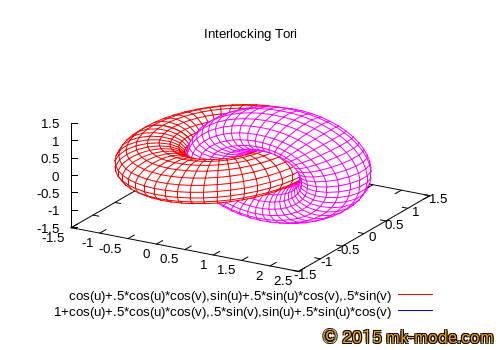
以下のような PNG 画像が作成される。
参考サイト
高機能な上に手軽に使用できるのが良いところでしょうか。
今回紹介した使用例はごく一部の機能に限定していましたが、使いこなすうちになれるでしょう。
また、統計解析用プログラミン言語 R でグラフを描画する場合と使い勝手等を比較してみたいとも思っています。
以上。

Comments